Neuromore
Neuromore is an EEG streaming and processing studio. Like BrainBay and BioEra, it is a visual environment used to process signals in real time.
Setting Up Your Environment
Windows: Neuromore Studio is available for Windows 10 and 11.
MacOS: Neuromore Studio is available for MacOS, but see the FTDI OS X fix before using it.
Linux: If you have Linux, you can use Neuromore through a virtual machine program like VirtualBox. Check out our VirtualBox tutorial here! See FTDI Linux Fix.
Installation
Download the latest version of Neuromore Studio for your operating system from their website. After installation, the application will be in the folder neuromore -> Studio.
To view software specifications of current and older releases, head to the Neuromore Studio Github repo.
Getting Started
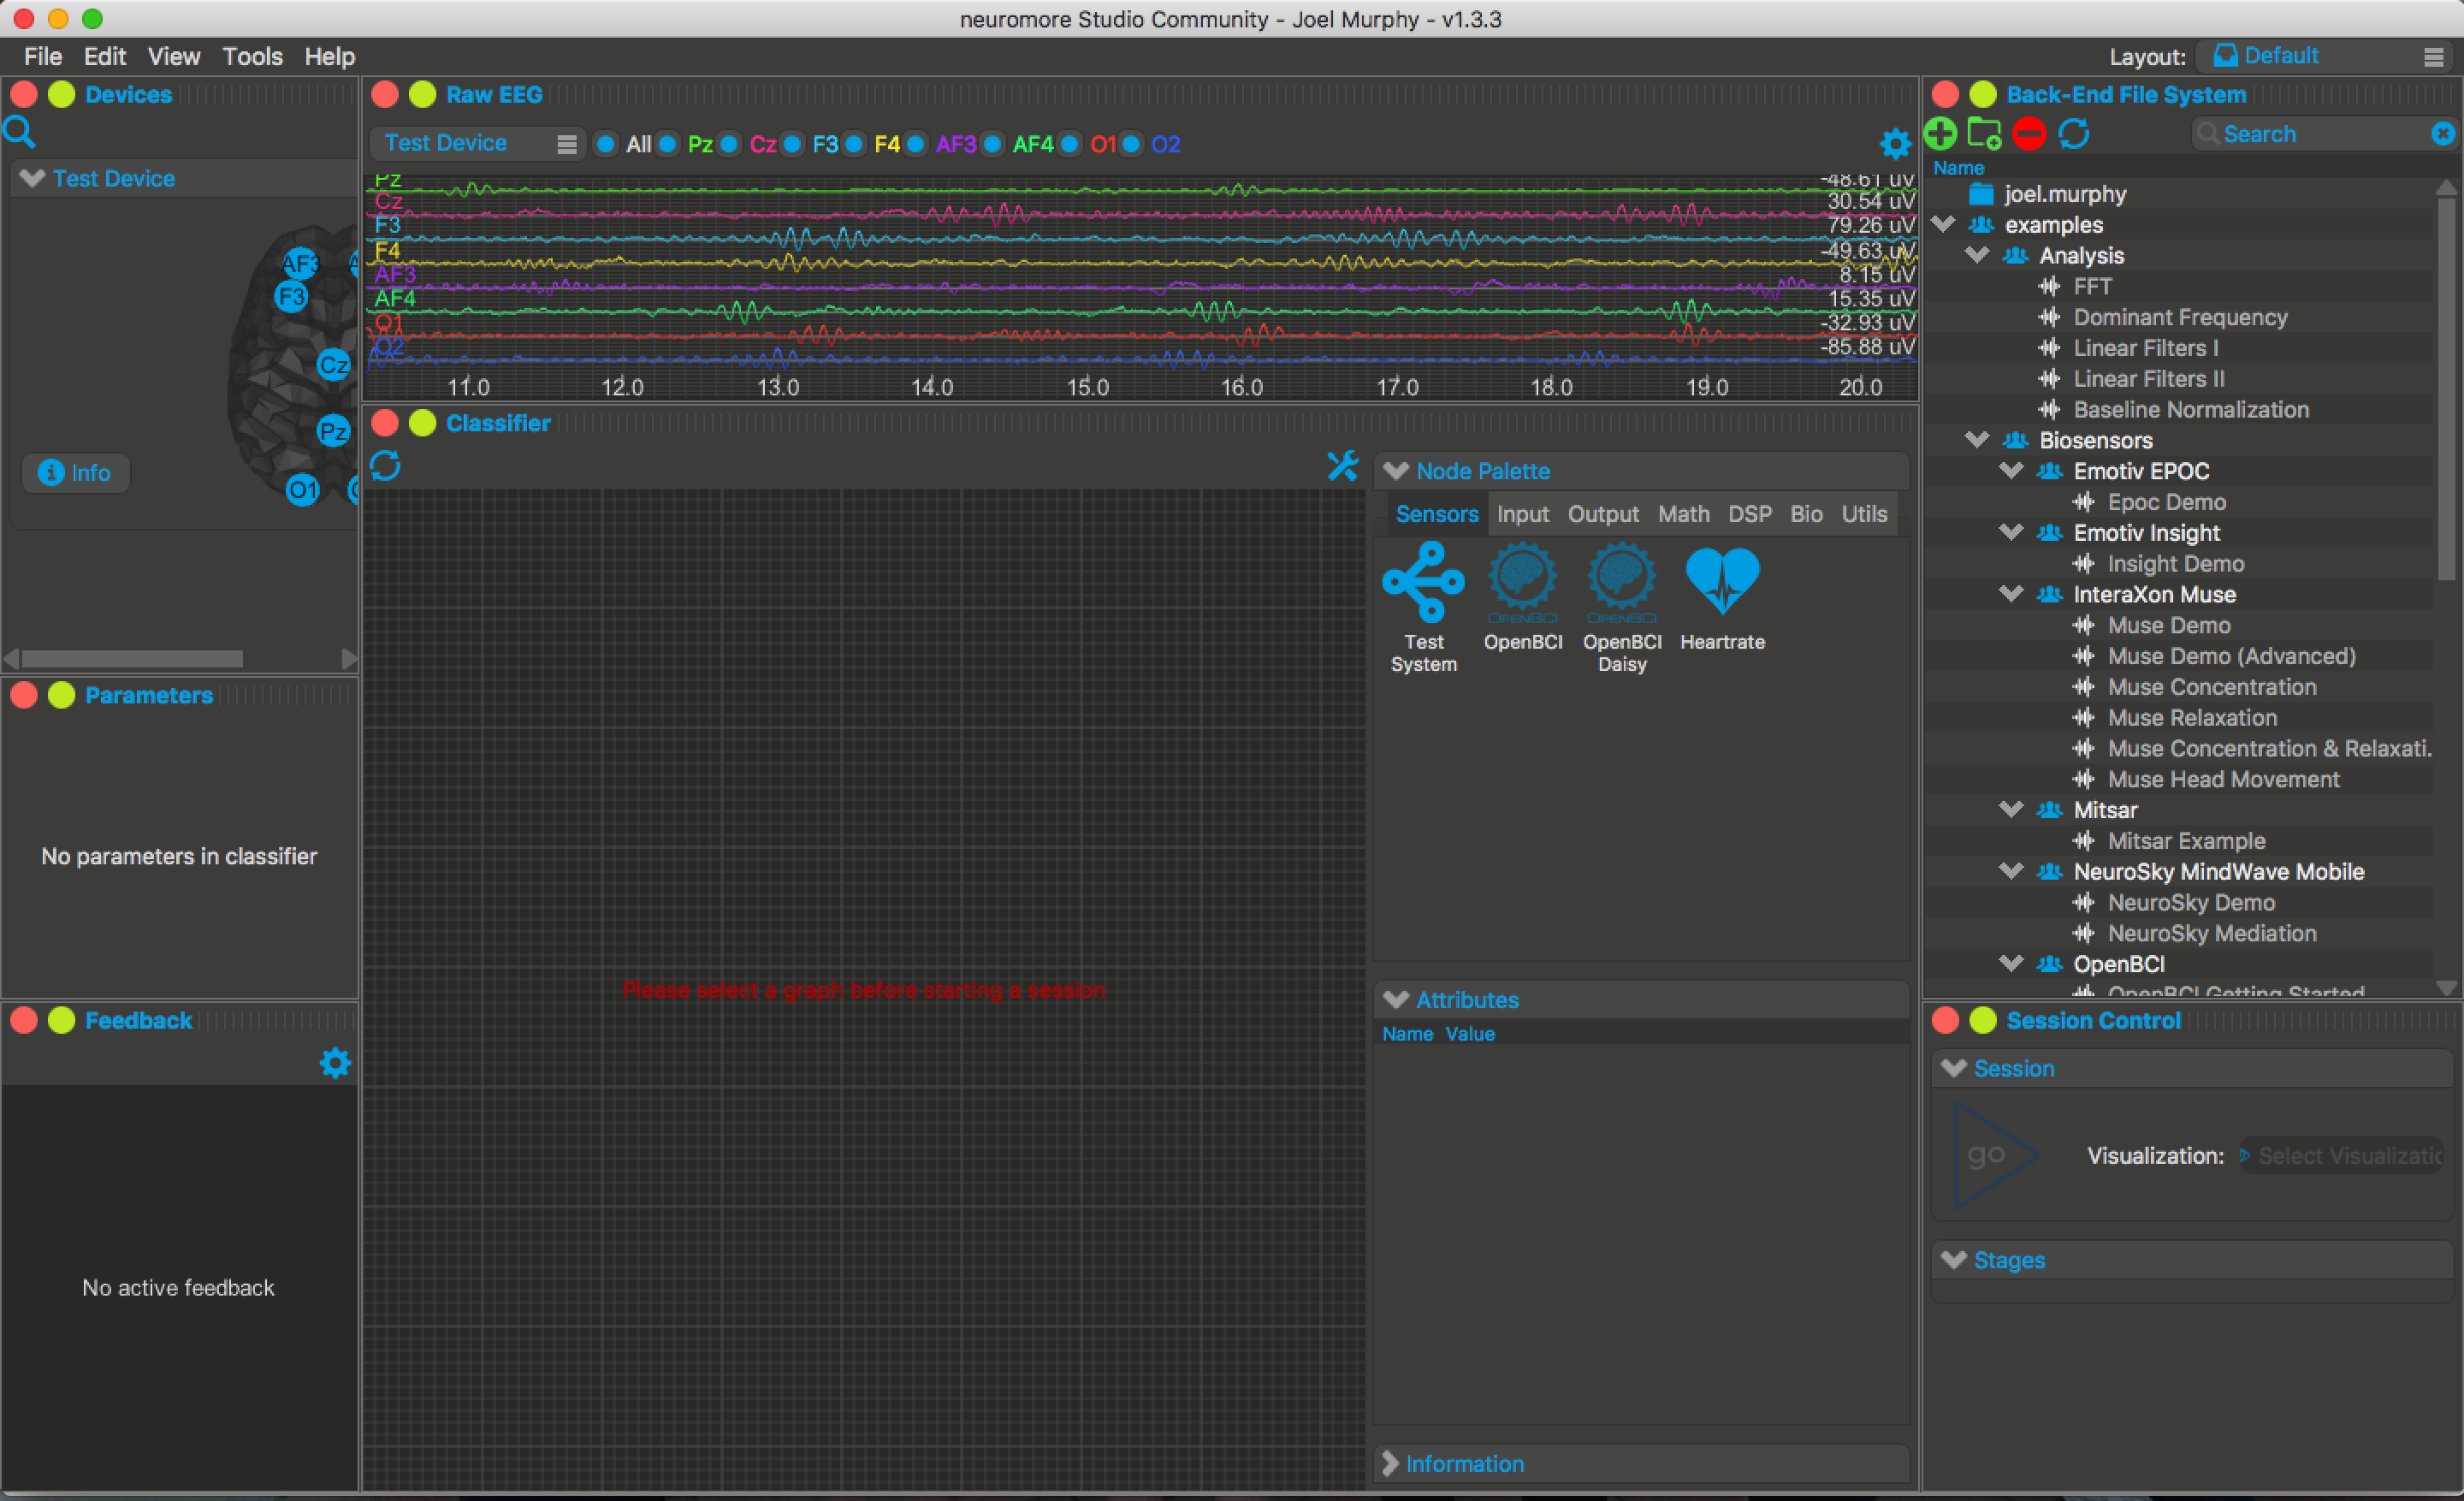
Open the Neuromore Studio application. A demo will begin playing, displaying example EEG data.
Livestream from OpenBCI to Neuromore
First, connect your OpenBCI board to your computer. Make sure to follow these steps:
Windows: Make sure your board is recognized as a COM port and that its latency is set to 1 ms. For troubleshooting, read our OpenBCI on Windows tutorial.
MacOS: Make sure your board is connected and visible as a device. To check, you can type ls /dev/tty.* in your terminal. An example of a connected OpenBCI board should look like this:
YourName-MacBook-Pro:~ YourName$ ls /dev/tty.*
		/dev/tty.OpenBCI-DN00959R
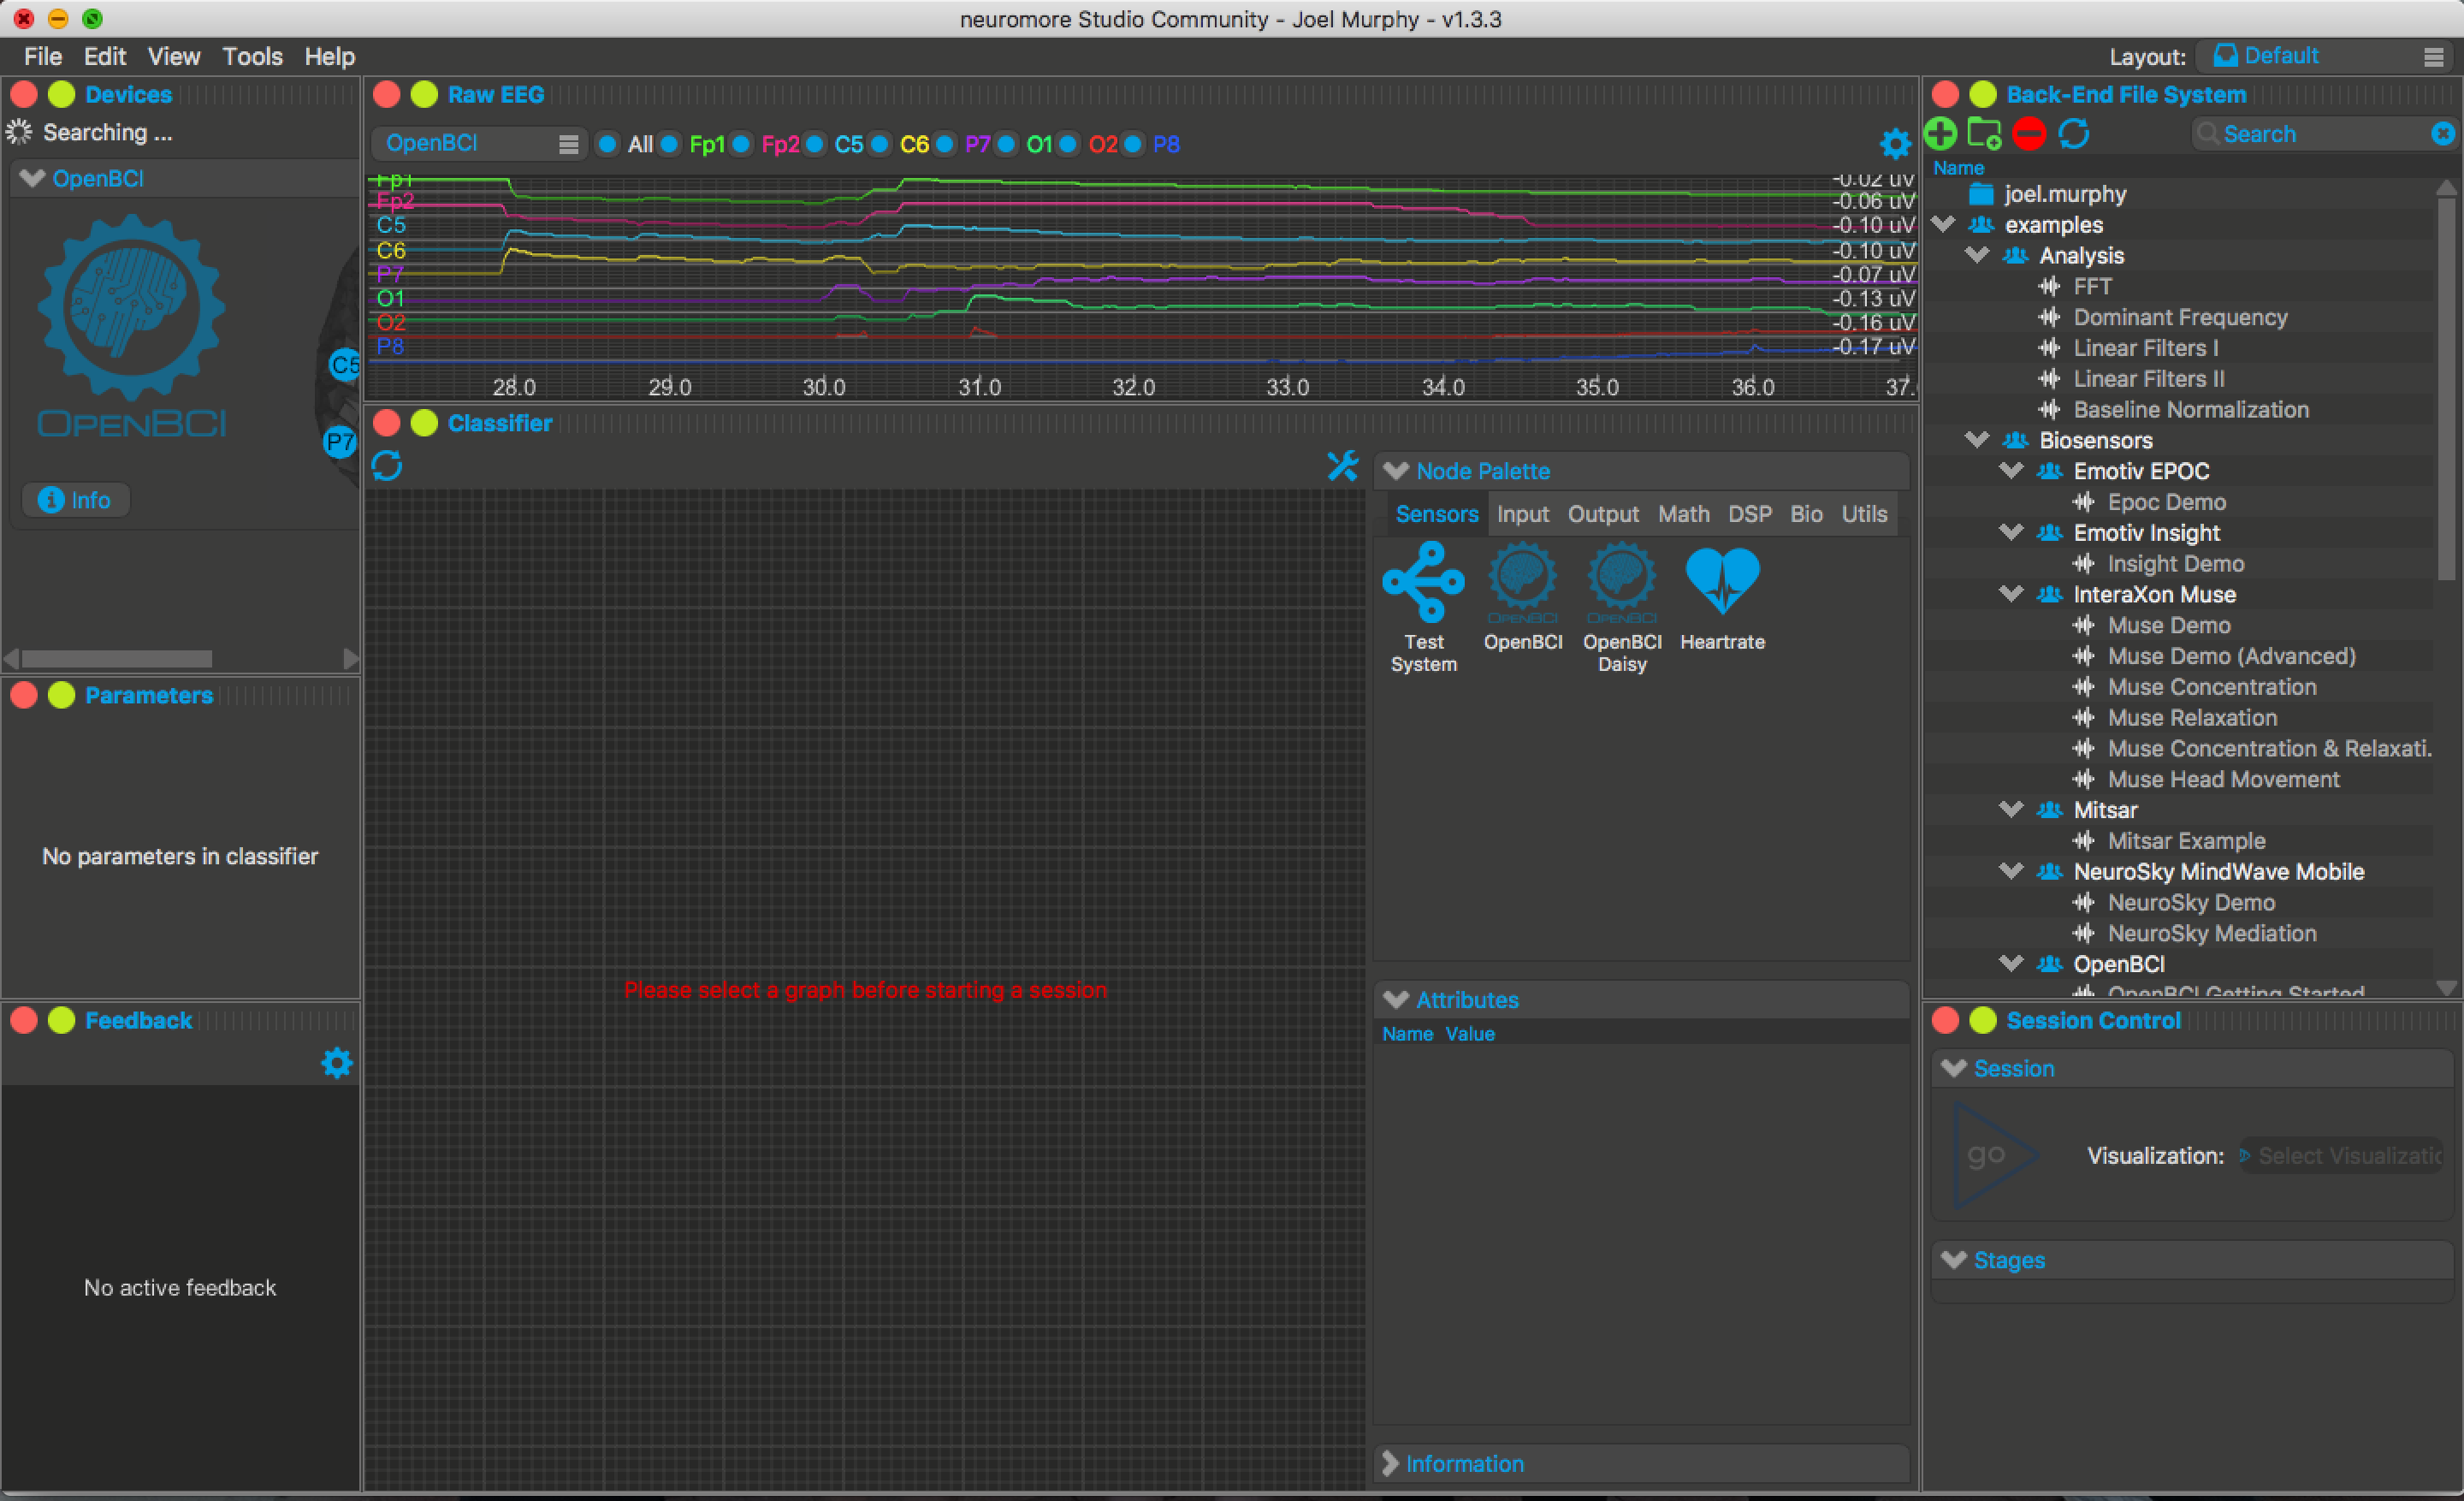
Now, to connect to your OpenBCI board from within Neuromore, click the magnifying glass under "Devices" in the top right corner. This will prompt Neuromore to search for new devices. You should see an OpenBCI logo appear, and data from your board will start streaming at the top of the Neuromore window.
Troubleshooting
If your OBCI Board doesn't show up in Neuromore Studio, try the following steps:
- Check dongle's underside switch is set to GPIO6.
- Check that your OBCI Board battery is fully charged. Use the USB battery charger included with your board kit.
- Close Neuromore, turn OBCI Board OFF, unplug dongle.
- Replug dongle, and reconnect OBCI board and dongle via these steps.
- Open Neuromore Studio again.
NOTE: If your board is connected properly, Neuromore should have no trouble connecting to it.
Getting Started
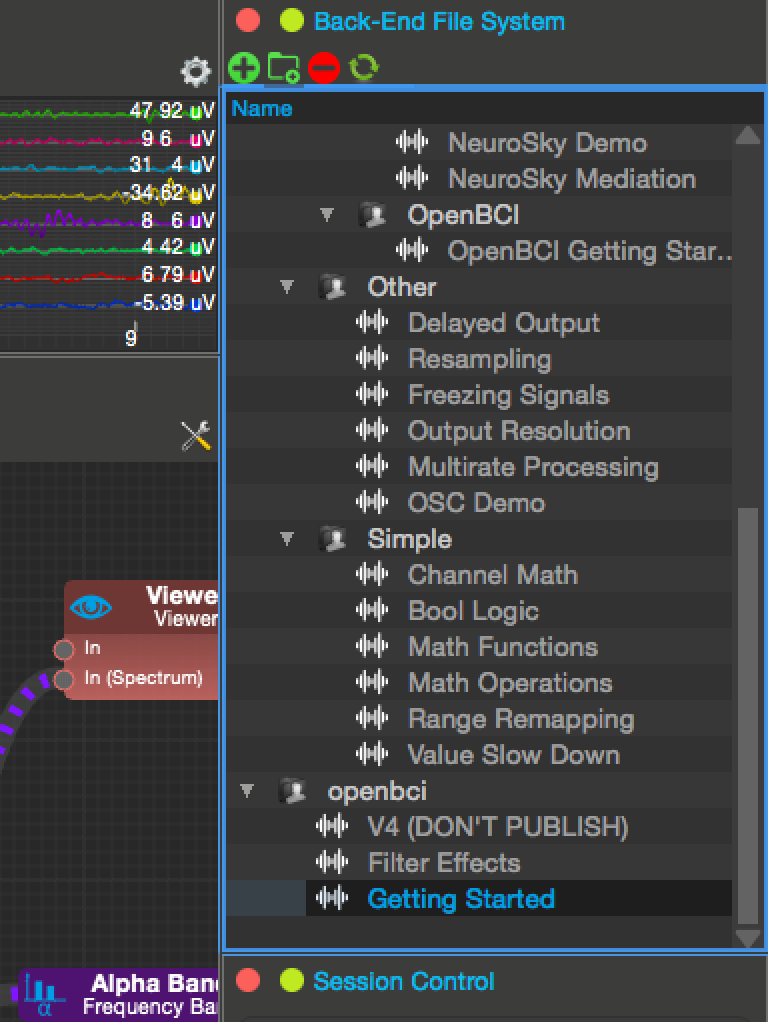
To get started with Neuromore, open the "Getting Started" classifier in the OpenBCI folder of the "Back-End File System" pane:
An example of Neuromore's visual programming language will appear. Click the wrench-and-screwdriver icon to hide the Node Palette pane if necessary.
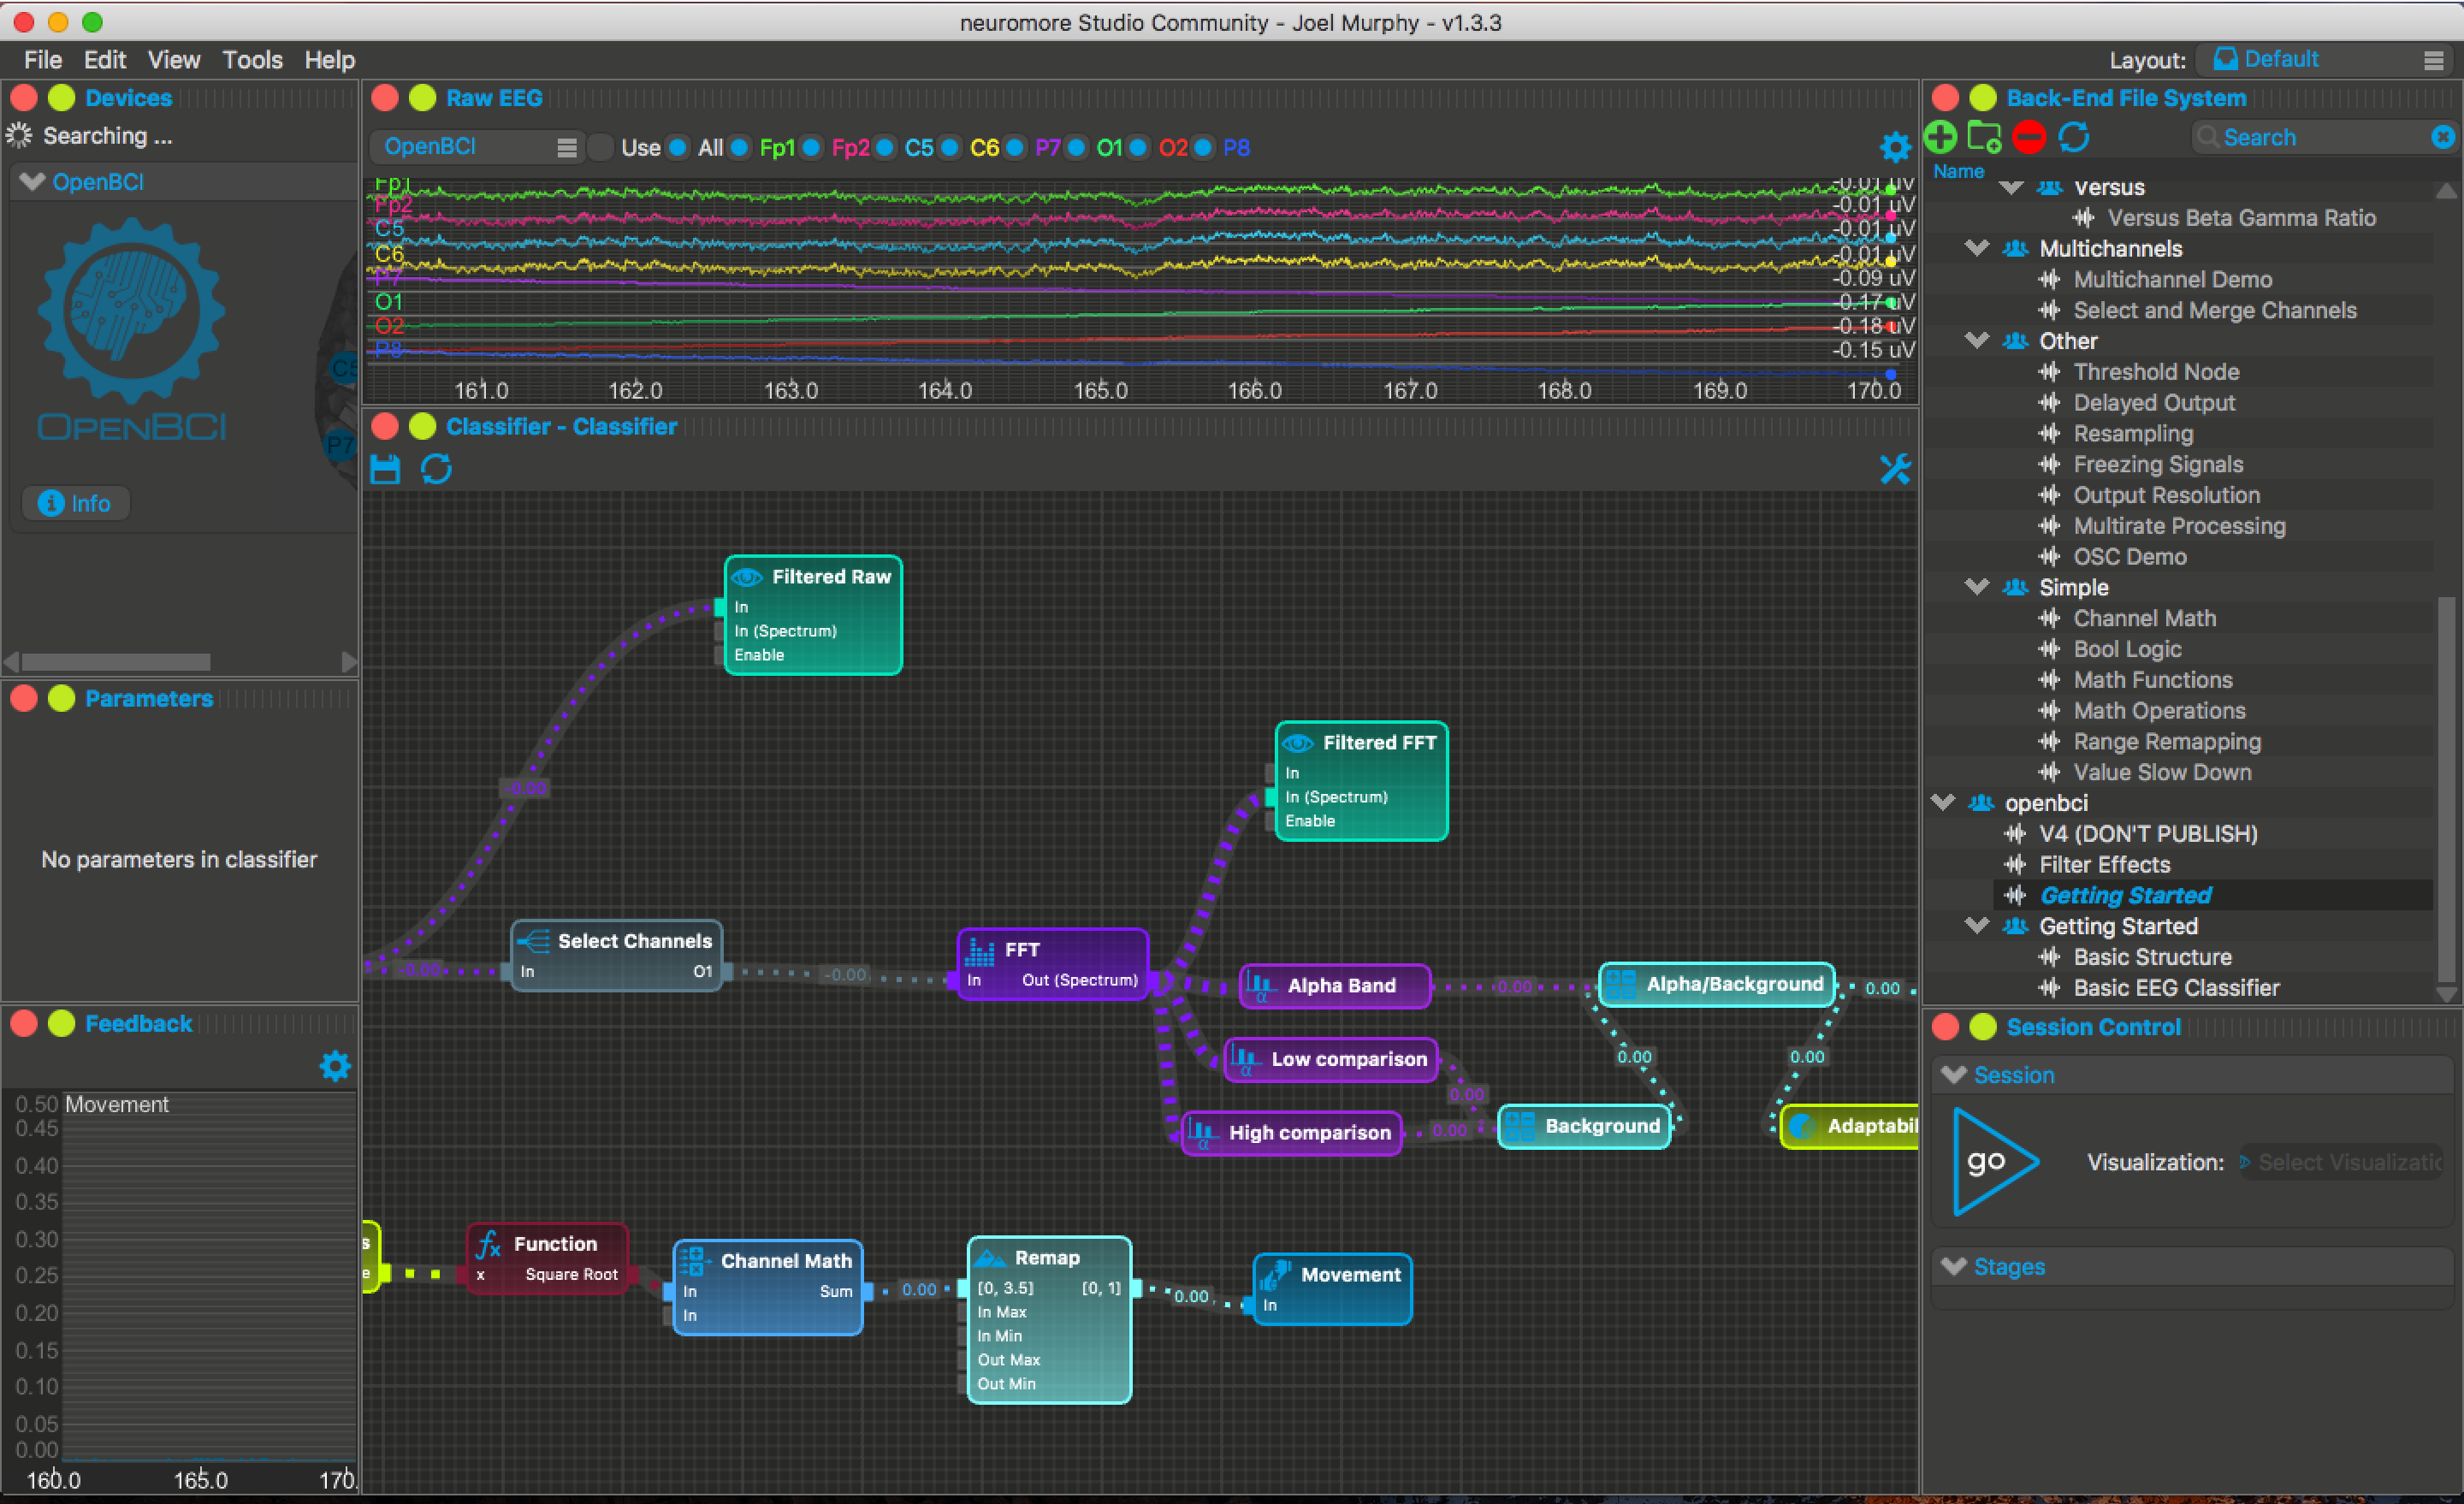
Neuromore calls these graphs of interconnected processing units "Classifiers". The basic structure of a classifer consists of a input device (such as OpenBCI V3) connected to processing nodes that end in some sort of output node.
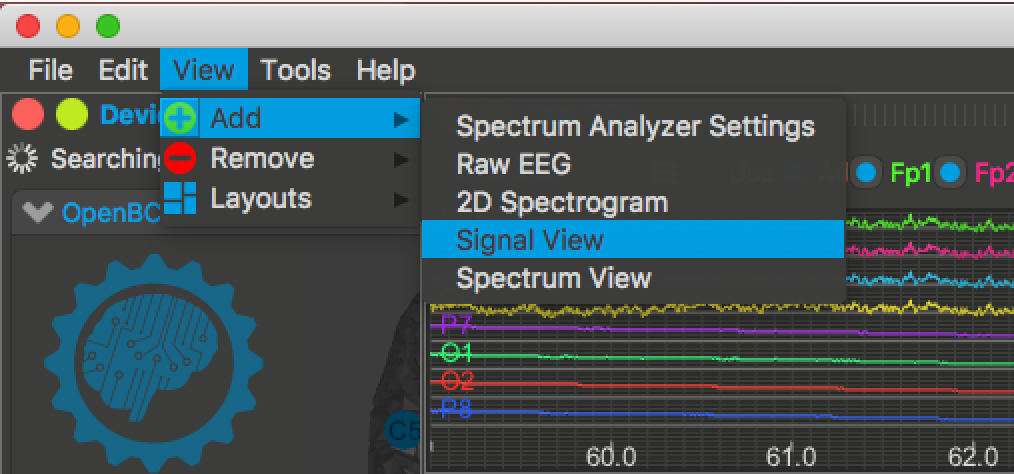
Some of the output nodes produce visual output, like graphs in the time or frequency domain. However, the default Neuromore Studio layout doesn't have windows open for those outputs. To add a window for time-domain outputs, click on the View tab of the toolbar, then Add -> Signal View.
A new window will appear. Click and drag the window to a convenient place in the Neuromore Studio Layout - it should snap into place, like below.
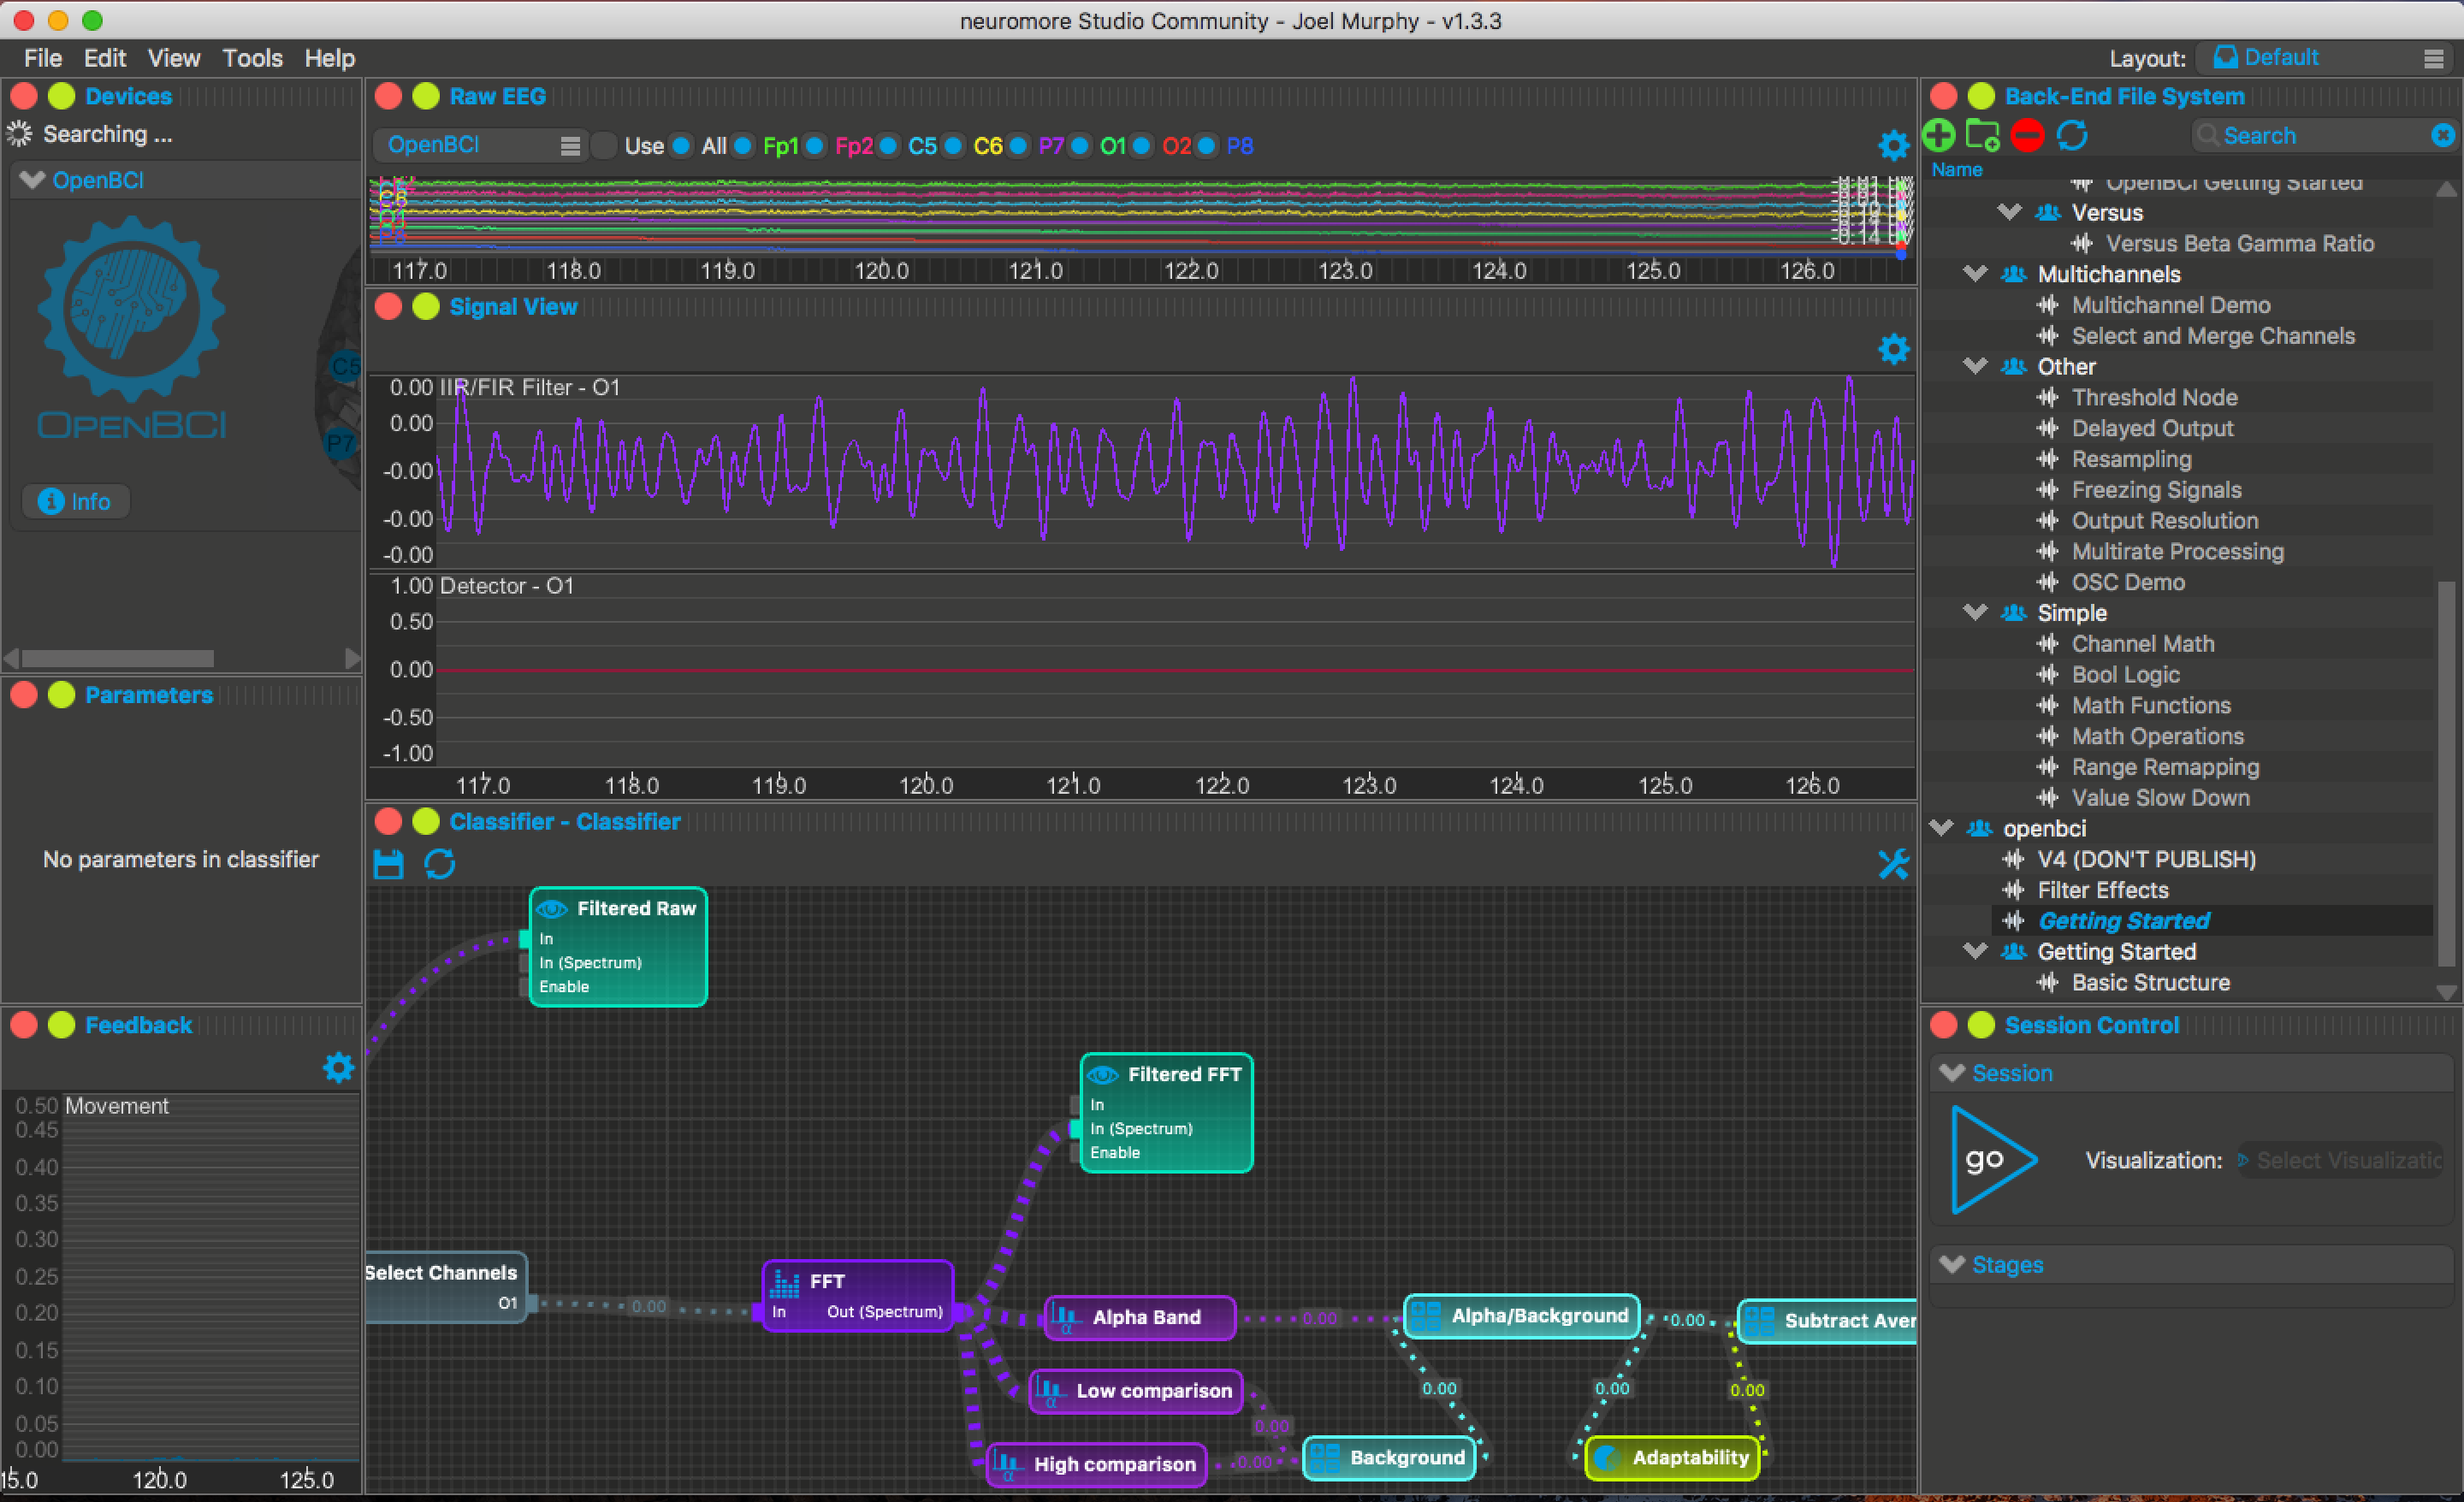
If you look at the Classifier window, you will notice there are three "output" nodes (nodes with an eye symbol): Filtered Raw, Filtered FFT, and Viewer. The Filtered Raw and View symbols are time-domain, and are the two symbols in the Signal View.
To add a window for frequency-domain outputs, click on View -> Add -> Spectrum View. Reposition the new window to a convenient place. You should see one signal, the Filtered FFT node.
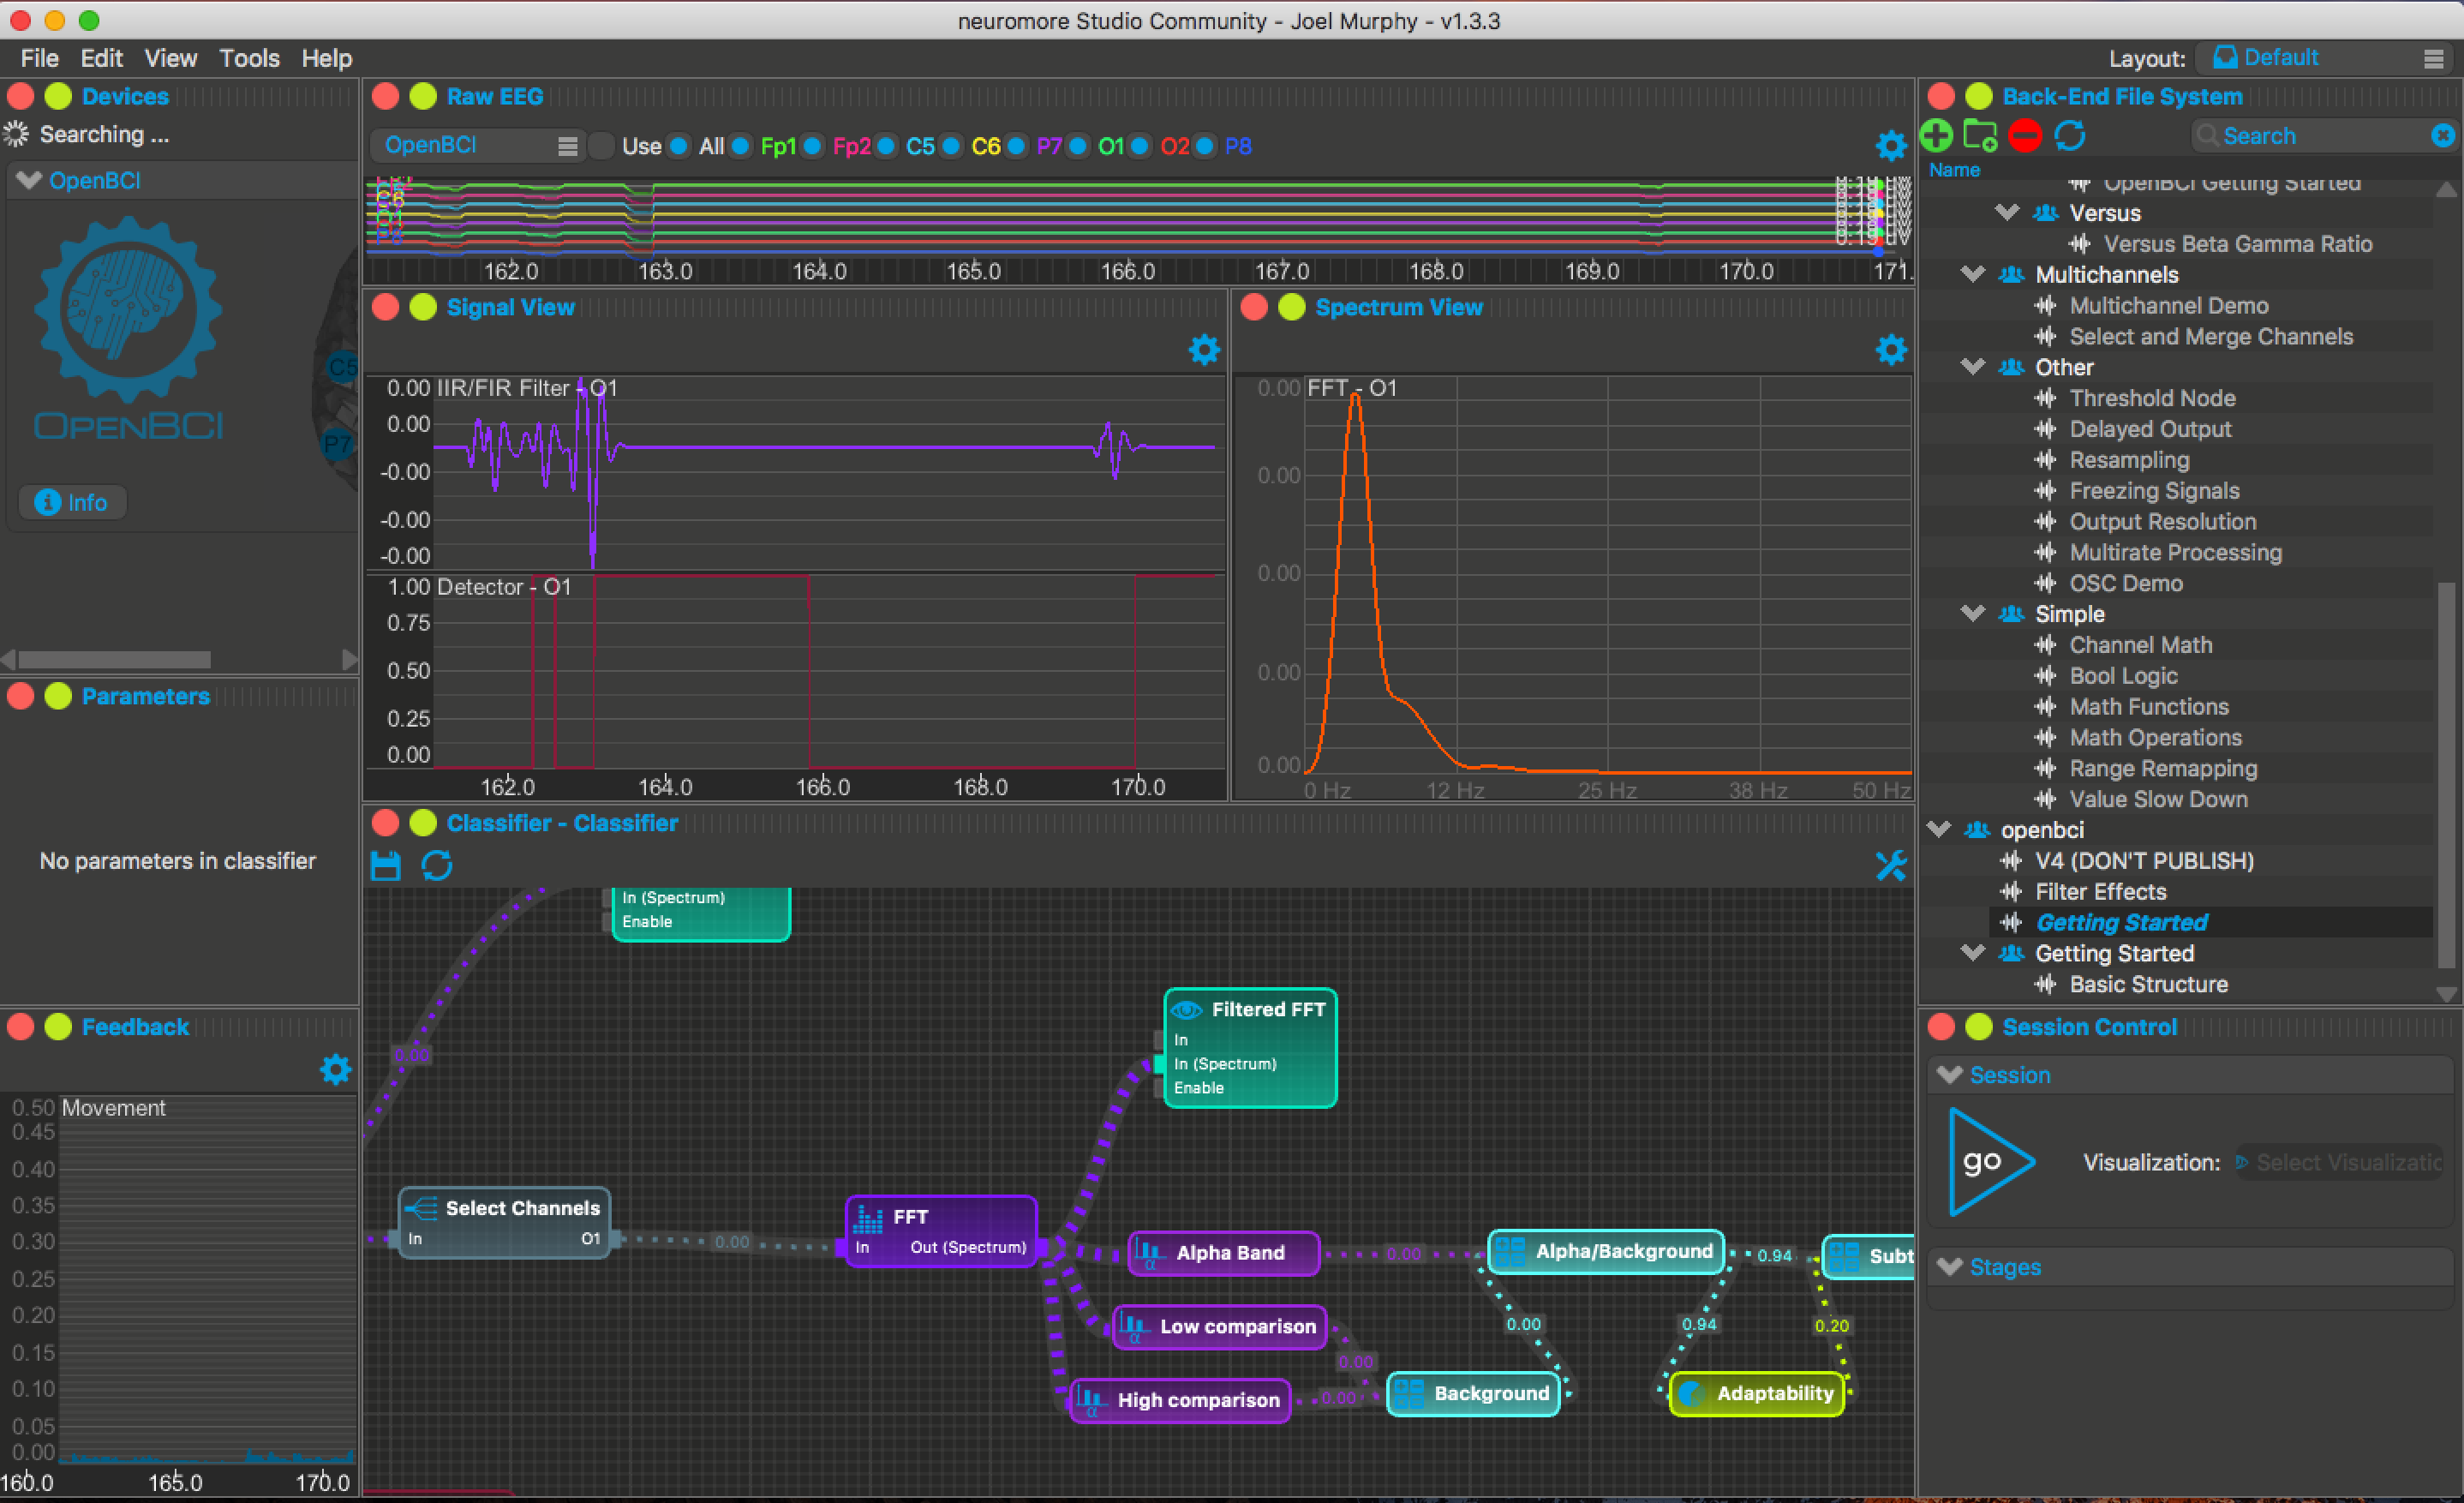
Want to double-check which signal corresponds to which output? Double click on one of the output nodes in the Classifier window. This should expand the Node Palette window. Display the Attributes tab and select "Custom Color". Double click on the block of color that appears to choose the color of your signal.
In the example below, I selected the "Filtered Raw" node, and set the color to bright green. The corresponding signal is now bright green in the Signal View window.

Now you're able to view the signals from your output nodes in your Classifier!
This sort of graphical programming (or visual programming) also appears in very popular programs like PureData and MAX for more general purposes and OpenViBE and of course neuromore for EEG specific processing.
The basic idea is that a stream of data that originates at the input device can then be mapped, processed and transformed into outputs that are useful, informative or just plain cool.
The getting started example for OpenBCI in the neuromore Studio explores these areas and how to properly use the graphical programming interface.
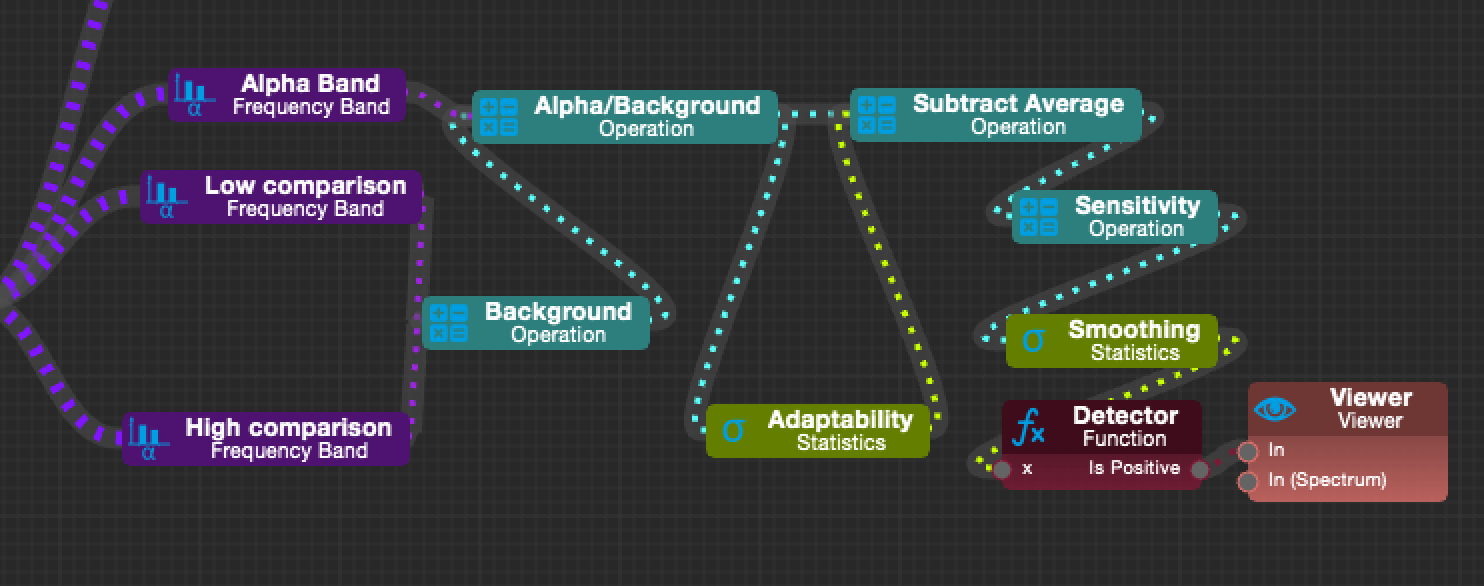
The best example within the classifier is perhaps the dynamic alpha detector.
This alpha detector maintains a 30 sec average of the ratio between the alpha (8-12 Hz) and the background signal intensity. The detector itself reports an alpha reward that is dynamically changed by the average alpha/background ratio. This system is adaptive to lower or high alpha environments and makes alpha rewards harder when the average alpha ratio is high and vice-versa.
By changing the "sensibility" parameter node you can then manually tune the relative "difficulty" that is necesary to attain an alpha detection.
This system is flexible to different electrodes and electrode placement as it adjusts dynamically its expectations of what alpha "looks like".
From this example we can see the power of statistics and simple logic that can easily be incorporated through visual programming into a complex and robust system.
Documentation and Resources
Did you use Neuromore and OpenBCI to build something new? Post about it on our forum!